来源:环球教育
小编:长安 429雅思bar chart类小作文怎么得高分?环球教育付博老师分享范围给大家!
剑桥-7
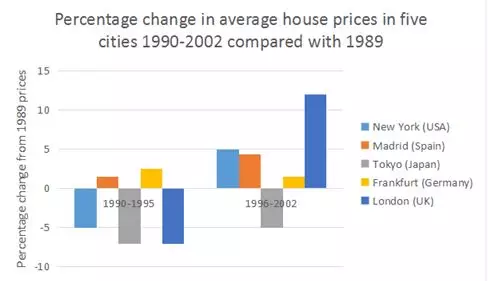
The chart below shows information about changes in average house prices in five different countries between 1990 to 2002 compared with the average prices in 1989.

高分范文
The chart compares the average house prices of five different cities with its own price in 1989 and overall it shows that among all five cities, three cities (New York, Tokyo and London) had house prices below the average from 1990 to 1995, while all given cities except Tokyo later had the prices all above the average from 1996 to 2002 , compared with average prices in 1989.
Apparently, Tokyo was the only place where its house price was continuously below the average by roughly 7% and 5% lower respectively. As is clearly illustrated, Frankfurt and Madrid were two cities whose average prices however consistently remained above the average. Unlike all three mentioned above, New York saw a noticeable fluctuation in its average house price from 5% below to 5% above the average during the entire time period. Interestingly, there was a more intensive change in London. Last of all, it is worth noting that regardless of the average prices in 1989, all cities had an increase in the house price throughout the given time period, except Frankfurt.